|
|
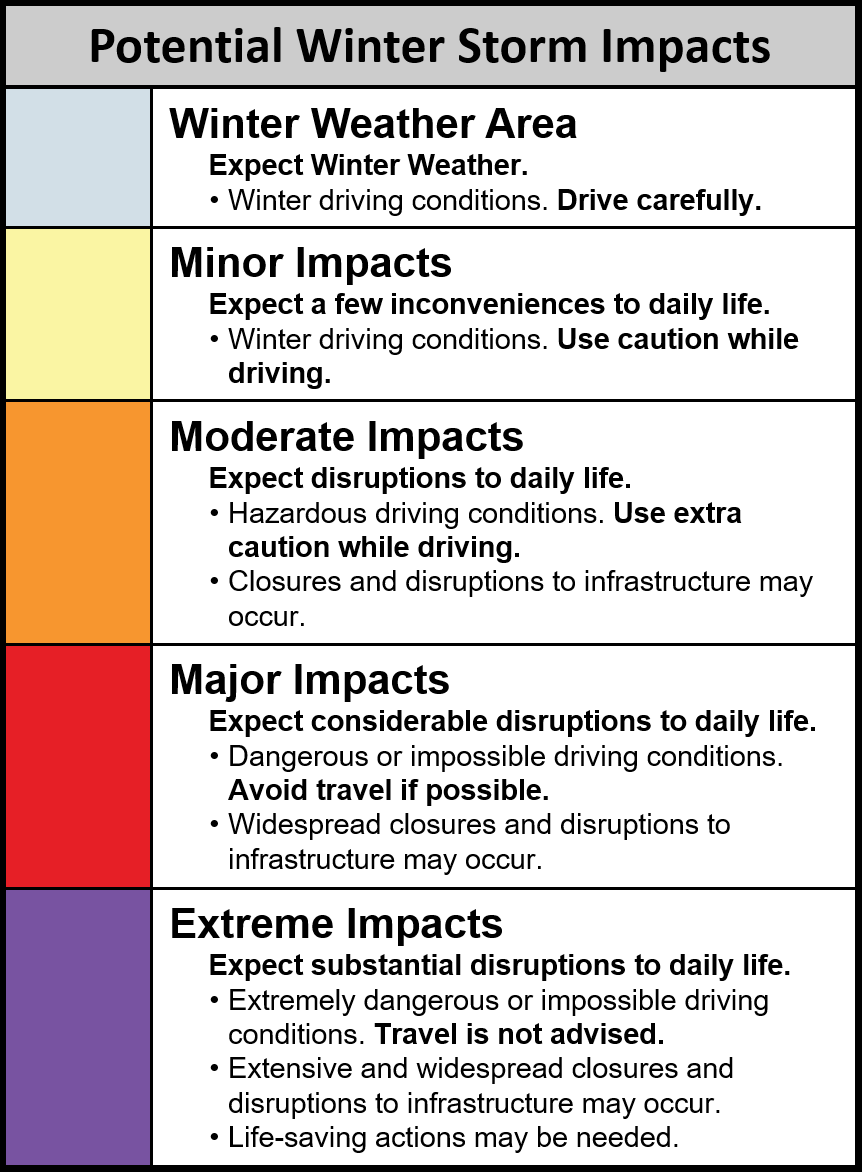
WSSI does not depict official warnings and should always be used in context with official NWS forecasts and warnings.
|
Overall Winter Storm Impacts:
Maximum impact from any of the components.
Snow Amount:
Potential impact from snow amount.
Snow Load:
Potential impact from the weight of snow on structures.
Ice Accumulation:
Potential impact from the ice accumulation and wind.
Blowing Snow:
Potential impact from falling snow combined with wind.
For a users guide and more information about the WSSI, please select from the dropdown menu below.
|
|
|
| Retrieve Static Images |
Select Zoom Area
|
|
|
|
|
To retrieve static images please select a zoom area and WSSI element.